- 18 Replication Status
- 18.1 Introduction
- 18.2 Configuring Replication Servers
- 18.3 Using the Replication Status Section
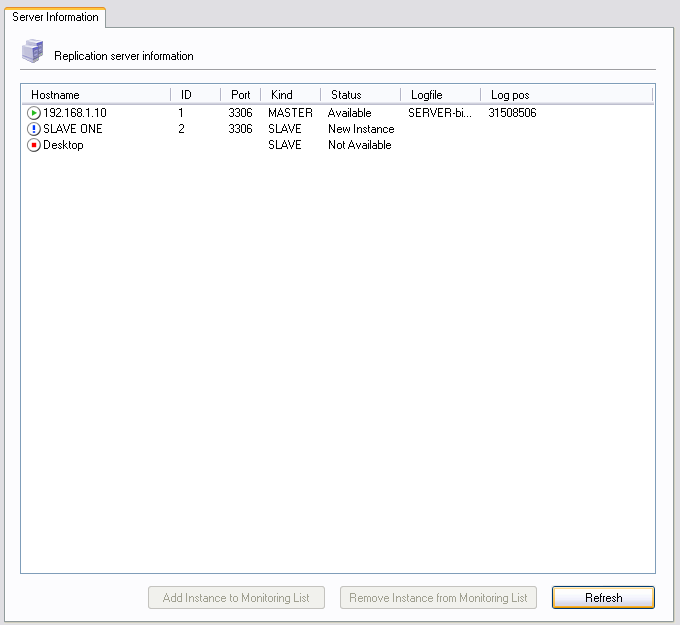
Once your servers are configured, they will appear in the
Replication Status section, as seen in the
following figure:
All servers are listed under the Hostname column, along with their server ID, Port, and current status.
New servers that are not currently being monitored will have an
exclamation mark as their status symbol, and will be listed as a
New Instance in the Status
column of their entry.
Servers that are currently being monitored and are online will
have a green status icon and will be listed as
Available in the Status
column of their entry.
Servers that are currently not in contact with the master server
will have a red status icon and will be listed as Not
Available.
There will be a slight delay between a slave machine going offline and having its status updated to allow for an adequate timeout in the communications between master and slave.
To start monitoring a new server that is not currently being monitored, click the Add Instance to Monitoring List button. To stop monitoring a server that is currently being monitored, click the Remove Instance from monitoring List button.

